observability

The observability building block provides monitoring (Prometheus, via kube-prometheus-stack), dashboards/alerting (Grafana), a Kubernetes web UI (Headlamp) — the latter two behind Keycloak SSO ([CT-005 OpenID Connect only ]) — and resource metrics for autoscaling (metrics-server).
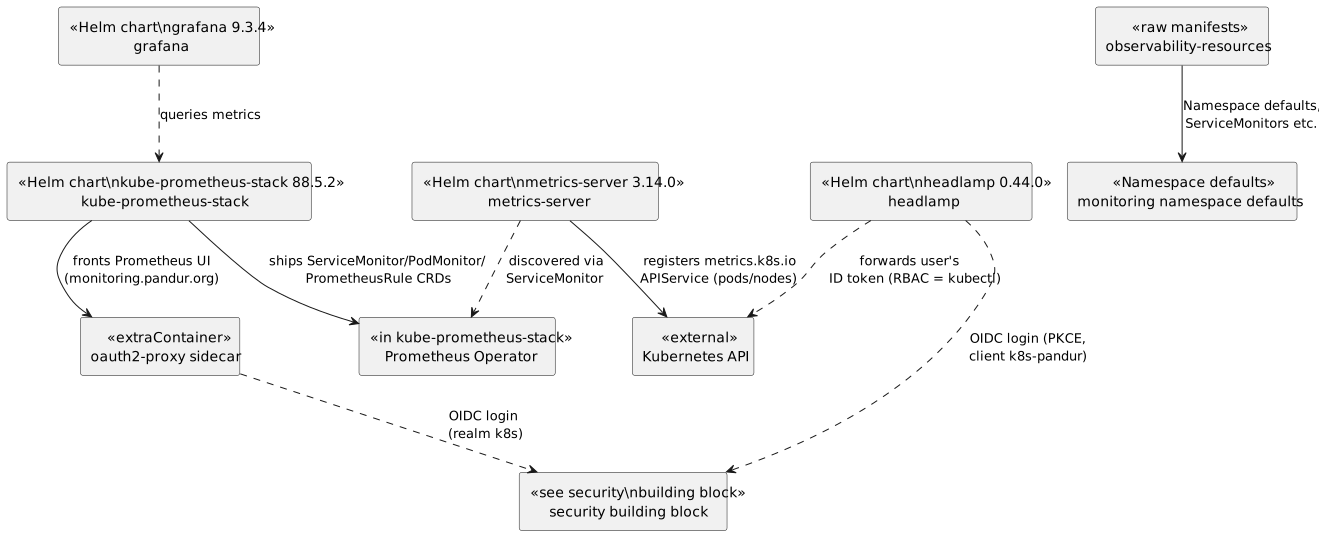
Applications inside the observability building block.
Figure 1. Applications inside the observability building block.
Application Chart / Source Namespace Purpose

kube-prometheus-stack

kube-prometheus-stack 88.5.2 (prometheus-community.github.io/helm-charts), Helm release name prometheus

monitoring

Prometheus, Alertmanager, kube-state-metrics, node-exporter, the Prometheus Operator, and the monitoring.coreos.com CRDs (ServiceMonitor, PodMonitor, PrometheusRule, Probe, Prometheus, Alertmanager). serviceMonitorSelectorNilUsesHelmValues/podMonitorSelectorNilUsesHelmValues/ruleSelectorNilUsesHelmValues/probeSelectorNilUsesHelmValues are all set to false so objects from any release/namespace are picked up (e.g. metrics-server’s ServiceMonitor). The Prometheus UI is fronted by an oauth2-proxy sidecar container performing OIDC login against Keycloak realm k8s (monitoring.pandur.org), since Prometheus itself has no built-in authentication. Replaces the previous standalone prometheus chart, which did not install the Prometheus Operator/CRDs.

grafana

grafana 9.3.4 (grafana.github.io/helm-charts)

monitoring

Dashboards and alerting UI, reachable at grafana.pandur.org. Its Prometheus datasource points at the prometheus-kube-prometheus-prometheus Service (port 9090).

headlamp

headlamp 0.44.0 (kubernetes-sigs.github.io/headlamp)

monitoring

Kubernetes web dashboard, reachable at console.pandur.org. Uses the same public, PKCE-based Keycloak client (k8s-pandur) as kubectl oidc-login, so RBAC for a Headlamp session is identical to a kubectl session — no separate authorization mapping is maintained.

metrics-server

metrics-server 3.14.0 (kubernetes-sigs.github.io/metrics-server)

kube-system

Registers the metrics.k8s.io APIService (pods/nodes), the resource metrics API that HorizontalPodAutoscaler (HPA) relies on for CPU/memory-based scaling. Without it, HPAs fail with unable to fetch metrics from resource metrics API. Deployed to kube-system as a core cluster component, consistent with other infrastructure add-ons (e.g. csi-driver-smb). Exposes a ServiceMonitor, scraped by kube-prometheus-stack.

observability-resources

raw manifests (pandur/observability/resources)

monitoring

Namespace-scoped defaults and any raw manifests supporting the above releases (e.g. additional `ServiceMonitor`s).

Grafana’s Helm values previously set ingress.ingressClassName: nginx / className: nginx (see [TR-004 Grafana ingress class inconsistency]); this has since been corrected to traefik, the cluster’s only supported ingress controller ([CT-006 Ingress Controller ]). The previous standalone prometheus chart had the same nginx ingress class issue; this was corrected to traefik as part of the migration to kube-prometheus-stack.
Migrating from the standalone prometheus chart to kube-prometheus-stack changes the release’s resource names (e.g. the Prometheus Service moves from prometheus-server to prometheus-kube-prometheus-prometheus) and the Prometheus/Alertmanager `StatefulSet`s are now created by the Prometheus Operator rather than directly by Helm. Existing Prometheus/Alertmanager PVC data is not automatically carried over by this change; verify retention requirements before cutting over a live cluster.

See Single Sign-On for how OIDC is wired for Grafana and Headlamp, and Observability Concept with Spring Boot, Prometheus, and JSON Logging for the overall monitoring concept.